Last updated on 1 January 2025
Important or Recent Updates
| Historic Updates | Date |
|---|---|
| Updated to use Container Manager and Projects | 29/05/2023 |
| Added additional security option to the compose to restrict the container from gaining new privileges | 25/10/2023 |
| Remove the need for setting up the synobridge network and allow the container to sit on its own isolated bridge | 14/07/2024 |
| There may be an issue with the CRON kicking in on new installations meaning the UI doesn’t update – to remedy this I have added an override to the compose | 22/07/2024 |
| Added note to database as minimum password length is 8 characters. Added example cron schedules for running more that once per day Added FAQ item relating to empty dashboards | 08/11/2024 |
What is Scrutiny?
Scrutiny is a Hard Drive Health Dashboard & Monitoring solution, merging manufacturer provided S.M.A.R.T metrics with real-world failure rates.
Let’s Begin
In this guide I will take you through the steps to get Scrutiny up and running in Docker.
Getting our drive details
We need to get some details about our drives in order for Scrutiny to read their SMART data.
It’s time to get logged into your Diskstation via SSH, in this guide I am using Windows Terminal however the steps will be similar on Mac and Linux,
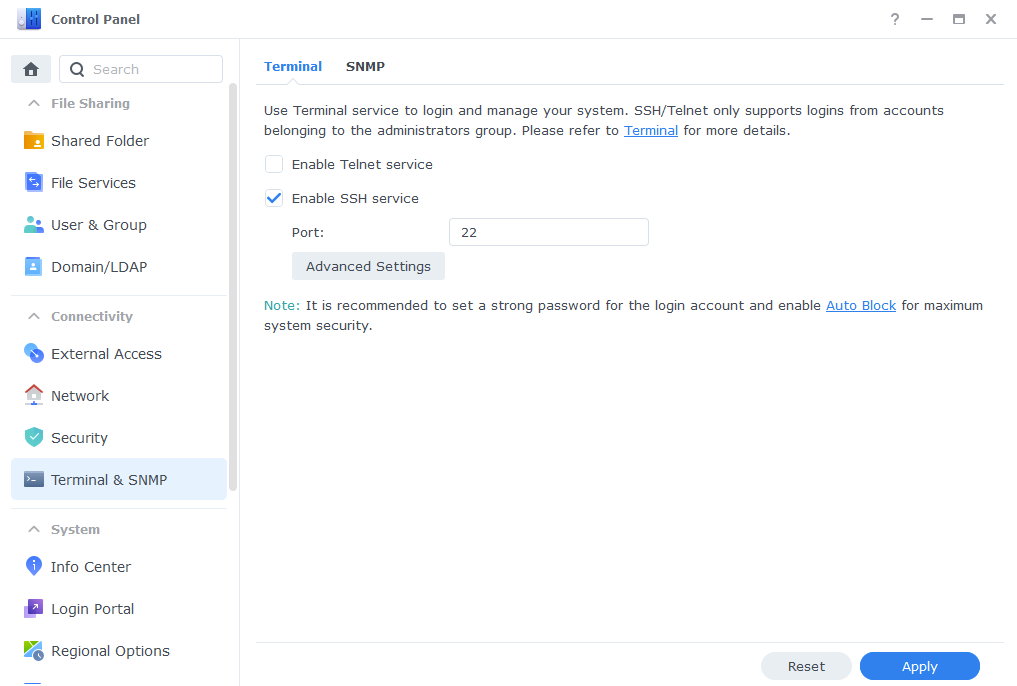
Head into the DSM Control Panel > Terminal & SNMP and then enable SSH service.
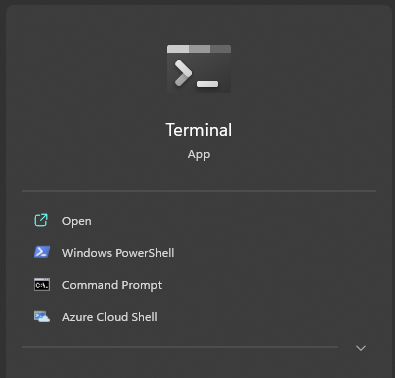
Open up ‘‘Terminal’
Now type ‘ssh’ then your main admin account username @ your NAS IP Address and hit Enter
ssh drfrankenstein@192.168.0.101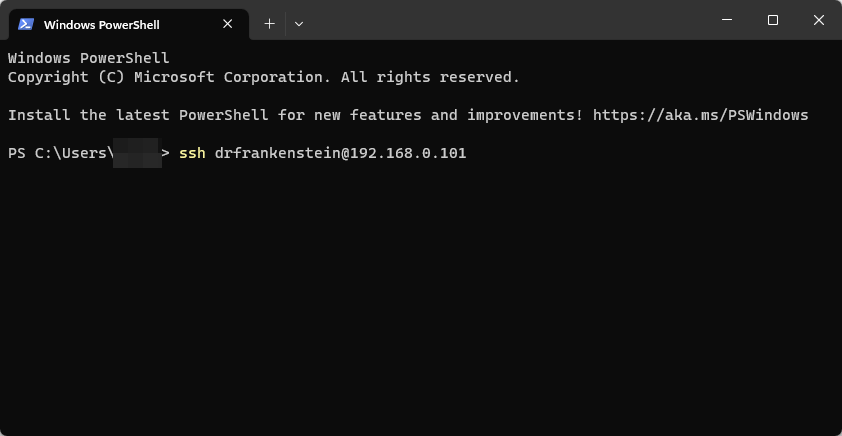
You will then be asked to enter the password for the user you used you can either type this or right click in the window to paste (you won’t see it paste the info) then press enter.
Enter the login information for your main Synology user account, you will not be able to see the password as you type it. (If you are using a password manager right-clicking in the window will paste – you won’t be able to see it)
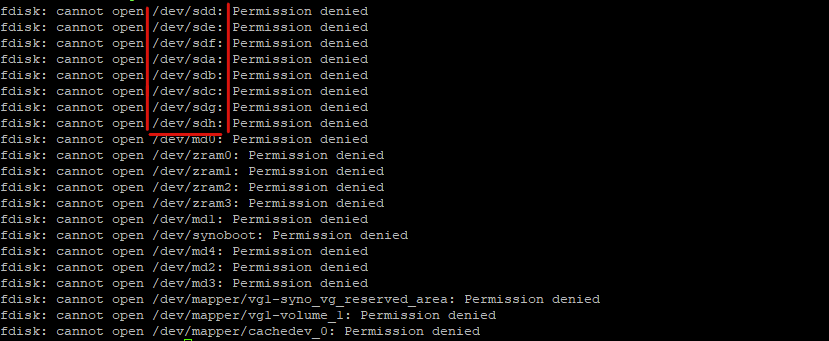
Now we are logged in we just need to do a single command to see our drives, note I am not prefacing this command with sudo as we don’t need the low level detail. You will see permission denied errors, but these can be ignored.
fdisk -lThe output you will see depends on the model NAS you own, the two examples below are from an 1821+ and an 1815+ which have 8 bays and the 1821+ has up to 2 NVMEs.
The 1815+ has 8 drives broken down from sda to sdh
The 1821+ has 8 drives broken down into SATA and NVME devices, sata1to sata8with the nvme0n1and nvme1n1. (Note if you have any eSATA devices connected these will also show)
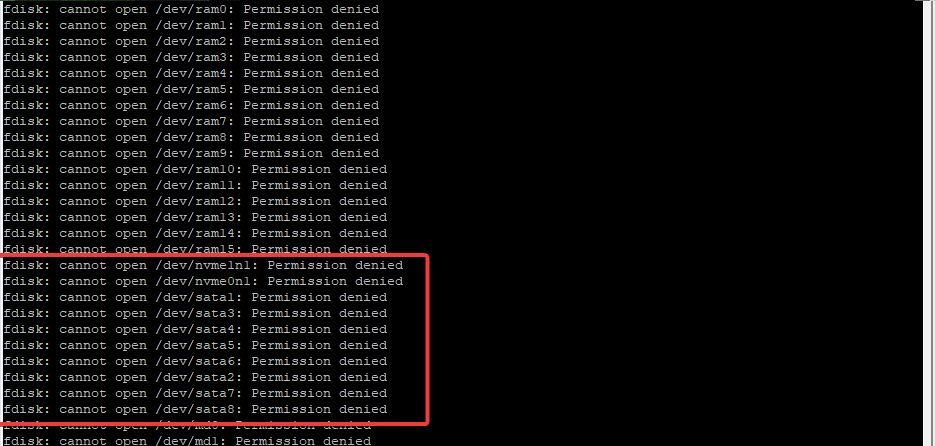
Make note of the devices you see in your output as we will need them for the config file and compose.
USB Drives
If you also want to add USB drives this will depend on whether the Manufacturer of the caddy passes this info on. I have commented out the USB extra parts in the config a bit further on.
Config Files and Folders
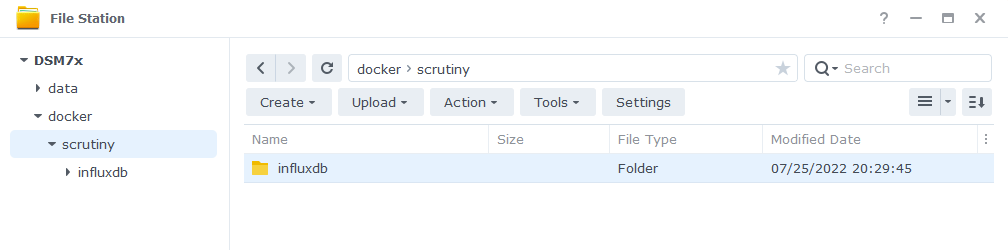
Next let’s create the folders the container will need. Head into File Station and create a subfolder in the ‘docker’ share called ‘scrutiny’ and then within that another called ‘influxdb’ it should look like the below.
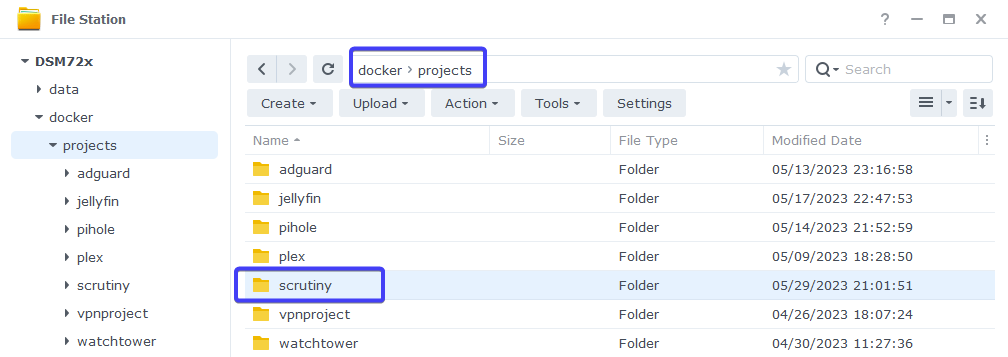
Then if you don’t have one already from my other guides create another folder in the ‘docker’ share called ‘projects’ and within that another one called ‘scrutiny’
Next comes the config files, You can edit this file in a number of ways, but to keep the guide OS-agnostic we will be using the Synology Text Editor package which can be installed via Package Center.
Open up a new text document and paste one of the two code snippets below into it. Use the one that matches up with the way your drives are shown in the previous step (if you come across anything different let me know in the comments!)
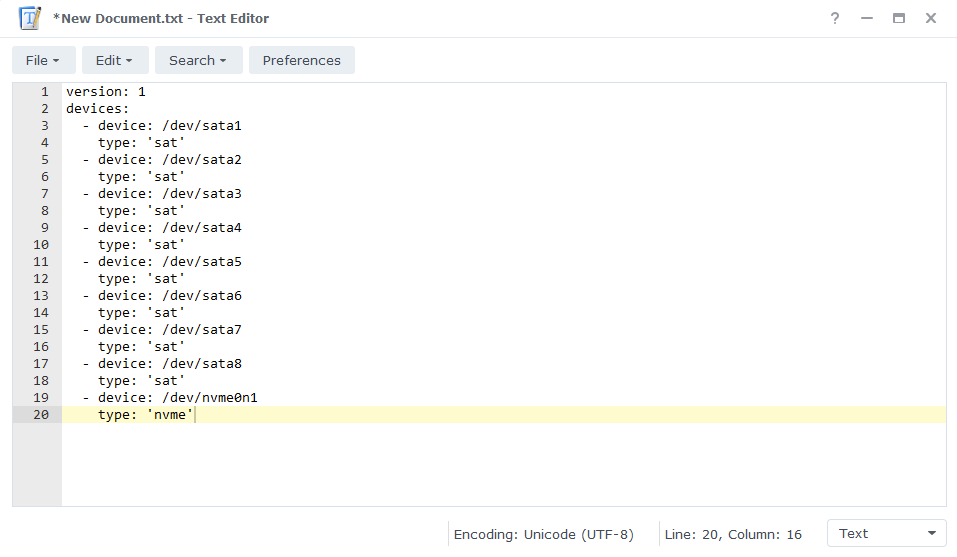
Type 1
version: 1
host:
  id: ""
devices:
  - device: /dev/sata1
    type: 'sat'
  - device: /dev/sata2
    type: 'sat'
  - device: /dev/sata3
    type: 'sat'
  - device: /dev/sata4
    type: 'sat'
  - device: /dev/sata5
    type: 'sat'
  - device: /dev/sata6
    type: 'sat'
  - device: /dev/sata7
    type: 'sat'
  - device: /dev/sata8
    type: 'sat'
  - device: /dev/nvme0n1
    type: 'nvme'
  - device: /dev/nvme1n1
    type: 'nvme'
#  - device: /dev/usb1
#    type: 'sat'
#  - device: /dev/usb2
#    type: 'sat'
Type 2
version: 1
host:
  id: ""
devices:
  - device: /dev/sda
    type: 'sat'
  - device: /dev/sdb
    type: 'sat'
  - device: /dev/sdc
    type: 'sat'
  - device: /dev/sdd
    type: 'sat'
  - device: /dev/sde
    type: 'sat'
  - device: /dev/sdf
    type: 'sat'
  - device: /dev/sdg
    type: 'sat'
  - device: /dev/sdh
    type: 'sat'
  - device: /dev/nvme0n1
    type: 'nvme'
  - device: /dev/nvme1n1
    type: 'nvme'
#  - device: /dev/usb1
#    type: 'sat'
#  - device: /dev/usb2
#    type: 'sat'
You will need to edit the config file in line with the number of drives you had in the output earlier either adding or removing lines accordingly, including adding or removing the NVME drives.
Also, I have included a couple of commented out lines for USB drives if you have them connected.
Next you can save this file as ‘collector.yaml’ in the ‘/docker/scrutiny’ folder.
Notifications Config (optional)
This step is optional and depends on if you want to set up some notifications in case one of your drive has issues.
As of writing there are 14 different notification method, as you can imagine I cannot cover every single type in this guide, but this will get the config file in place for you to amend based on your preferences
Open up a new file Text Editor again, this time you need to copy and paste the full contents of the example config file located here
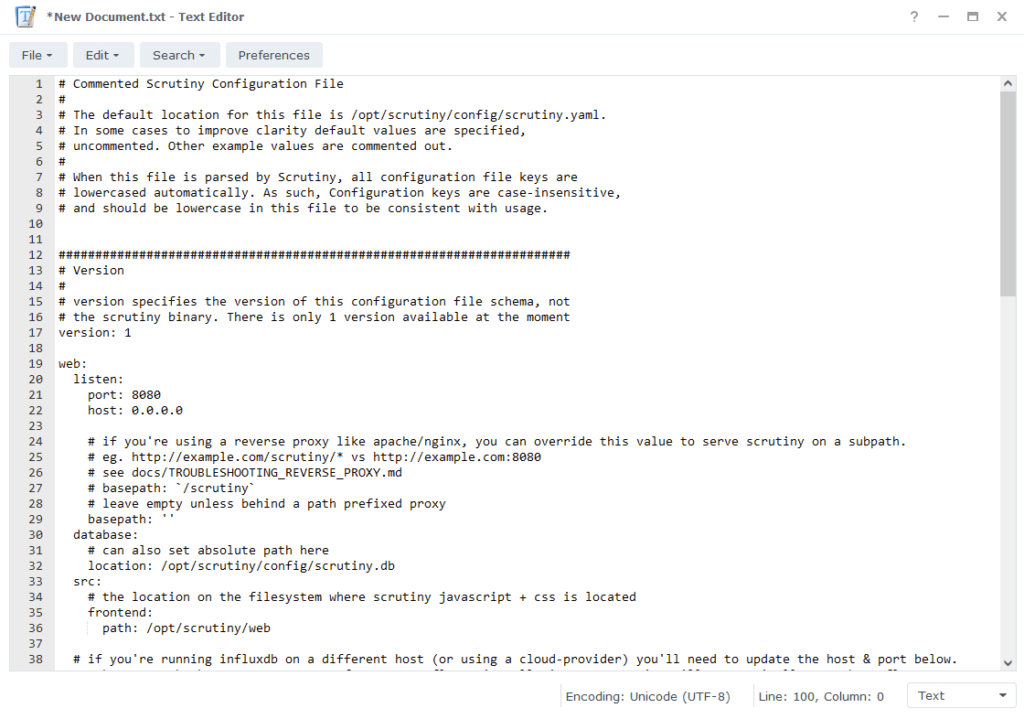
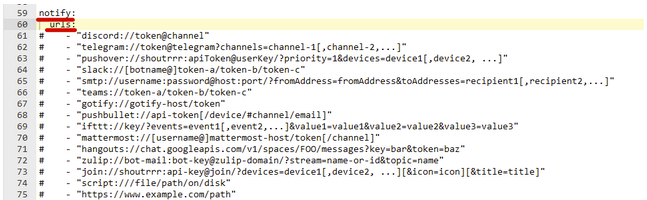
Scroll to the bottom of the file where you will see a number of config options for notifications. You will need to the remove the # from the ‘notify’ and ‘urls’ lines and then depending on which type of notification you decide to set up the # will need to be removed from the corresponding line.
The level of notification you receive (Critical or All Issues) can be set up in the WebUI once Scrutiny is up and running.
Finally, save this file as ‘scrutiny.yaml’ into the /docker/scrutiny folder.
Docker Compose
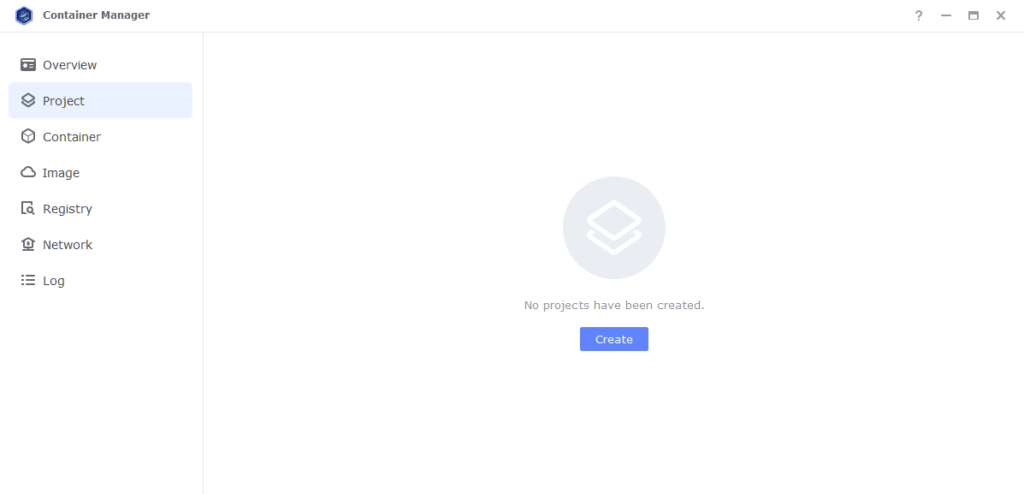
We will be using Docker Compose in the Projects section of Container Manager to set up the container.
Open up Container Manager and click on Project then on the right-hand side click ‘Create’.
In the next screen we will set up our General Settings ‘Project Name’ will be ‘scrutiny’ the ‘Path’ click the button and select the folder we created earlier in ‘/docker/projects/scrutiny’. ‘Source:’ change the drop-down to ‘Create docker-compose.yml’.
Next we are going to drop in our docker compose configuration copy all the code in the box below and paste it into line ‘1’ just like the screenshot.
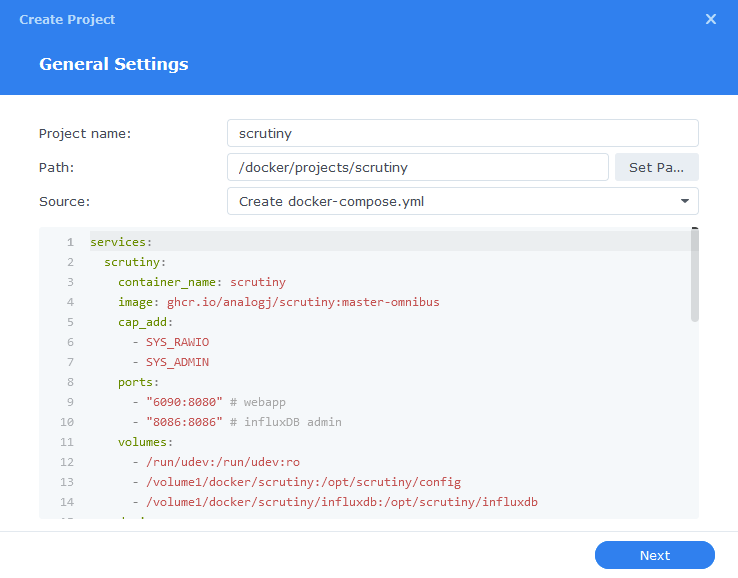
services:
  scrutiny:
    container_name: scrutiny
    image: ghcr.io/analogj/scrutiny:master-omnibus
    cap_add:
      - SYS_RAWIO
      - SYS_ADMIN
    ports:
      - 6090:8080/tcp # webapp
      - 8086:8086/tcp # influxDB admin
    volumes:
      - /run/udev:/run/udev:ro
      - /volume1/docker/scrutiny:/opt/scrutiny/config
      - /volume1/docker/scrutiny/influxdb:/opt/scrutiny/influxdb
    devices:
      - /dev/nvme0n1:/dev/nvme0n1
      - /dev/nvme1n1:/dev/nvme1n1
      - /dev/sata1:/dev/sata1
      - /dev/sata2:/dev/sata2
      - /dev/sata3:/dev/sata3
      - /dev/sata4:/dev/sata4
      - /dev/sata5:/dev/sata5
      - /dev/sata6:/dev/sata6
      - /dev/sata7:/dev/sata7
      - /dev/sata8:/dev/sata8
#      - /dev/usb1:/dev/usb1
#      - /dev/usb2:/dev/usb2
    environment:
      - SCRUTINY_WEB_INFLUXDB_TOKEN=ANYLONGSTRING
      - SCRUTINY_WEB_INFLUXDB_INIT_USERNAME=A-USERNAME
      - SCRUTINY_WEB_INFLUXDB_INIT_PASSWORD=A-PASSWORD
      - COLLECTOR_CRON_SCHEDULE=0 23 * * *
    security_opt:
      - no-new-privileges:true
    restart: unless-stopped
As you can see the devices section contains all our drives, you will need to amend this again in line with the config file you created earlier. You will need to amend the paths each side of the : so they match, adding or removing drives accordingly including the NVMEs.
e.g., /dev/sata1:/dev/sata1 or /dev/sda:/dev/sda and so on.
In addition to this you will see in the ‘environment’ section three variables that will need to be updated as outlined below, these secure the database used by scrutiny.
| Variable | Value |
|---|---|
| SCRUTINY_WEB_INFLUXDB_TOKEN | enter a sting of characters you can use almost anything treat it like a password so a nice long string |
| SCRUTINY_WEB_INFLUXDB_INIT_USERNAME | This can be anything you like |
| SCRUTINY_WEB_INFLUXDB_INIT_PASSWORD | a secure password (min of 8 characters) |
| COLLECTOR_CRON_SCHEDULE | 0 23 * * *This overrides the default cron schedule at midnight and runs at 23:00 You can change the schedule to run more than once per day by using https://crontab.cronhub.io/ to get the right code to include. For example 0 * * * * is hourly. |
These 3 values are only required for the first ever setup – you can remove them once Scrutiny is up and running but keep them safe in case you ever need them. Maybe in Vaultwarden!
Once you have made the edits press ‘Next’
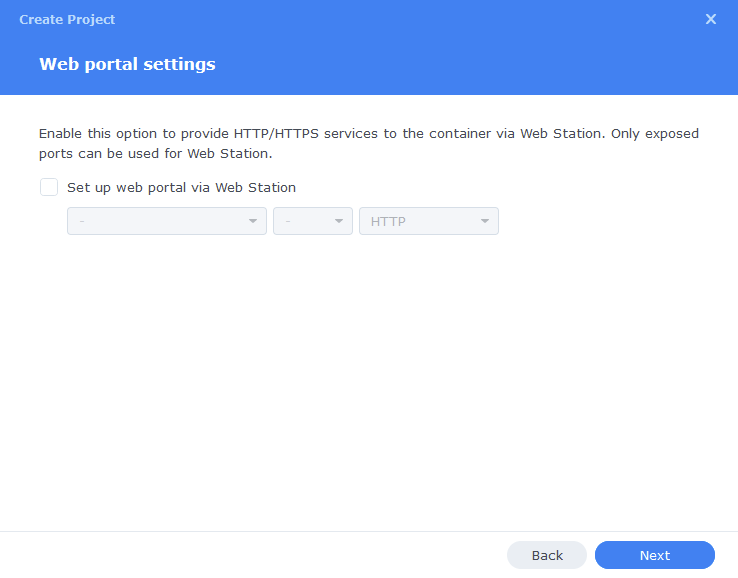
You do not need to enable anything on the ‘Web portal settings’ screen click ‘Next’ again.
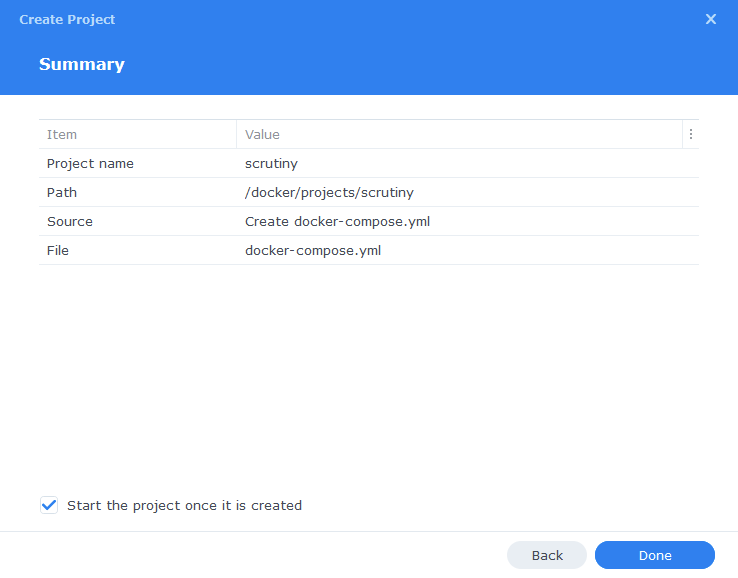
On the final screen click ‘Done’ which will begin the download of the container image and once downloaded they will be launched!
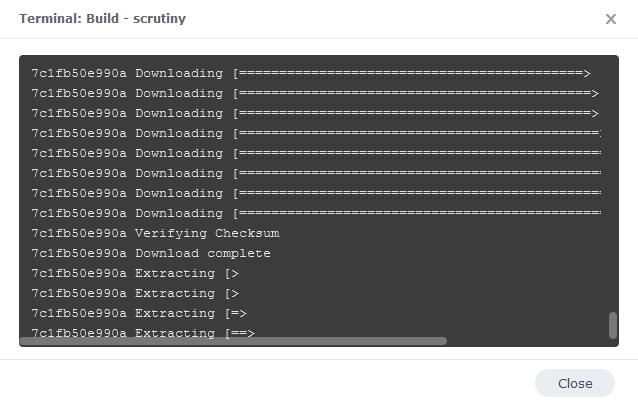
You will now see Scrutiny running and should have a green status on the left-hand side.
You should now be able to access the Scrutiny WebUI by going to your NAS IP followed by port 6090
e.g., 192.168.0.30:6090
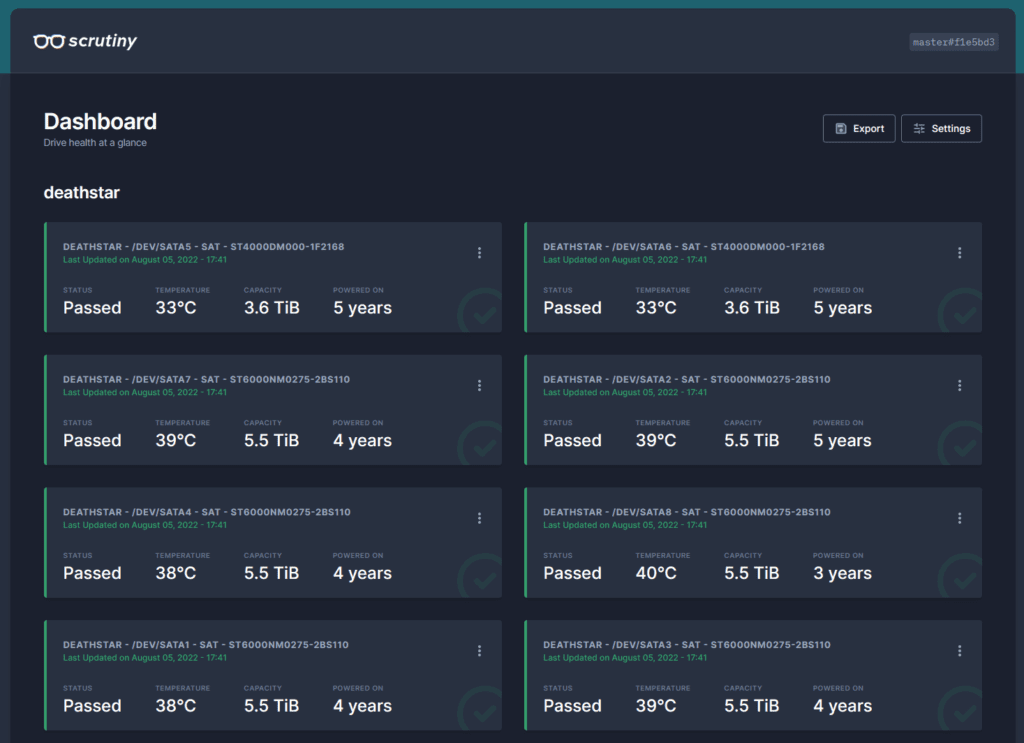
Sometimes it can take a few minutes before all your drives appear, as Scrutiny needs to obtain their information so don’t panic if it’s initially empty. You can now adjust settings for the UI and Notifications in the WebUI.
FAQ (Frequently Asked Questions)
I added extra drives to my config, and they don’t appear in the UI even after waiting
You can overcome this by stopping the overall Project and then rebuilding it via Action > Build in the Container Manager UI
My dashboard is empty and shows no drives
If you have waited until after the initial scan and still no drives appear then you can try triggering a manual scan via SSH
sudo docker exec scrutiny /opt/scrutiny/bin/scrutiny-collector-metrics runLooking for some help, join our Discord community
If you are struggling with any steps in the guides or looking to branch out into other containers join our Discord community!

Buy me a beverage!
If you have found my site useful please consider pinging me a tip as it helps cover the cost of running things or just lets me stay hydrated. Plus 10% goes to the devs of the apps I do guides for every year.


hi, when the container manager tries to build the project, I get an error that the project could not be built
“bind mount failed: ‘/volume2/docker/scrutiny/inflkuxdsb’ does not exist
Hey – Did you edit the compose with the correct folder names.There is a typo in your “inflkuxdsb” folder “influxdb”
got it. it works now.
thanks!
Hey @Dr_Frankenstein, I have followed these instructions to install Scrutiny on my DS1522+ but I cannot get any of my sata or nvme disks to show up.
Here are my compose.yaml, collector.yaml, and fdisk -l results: https://paste.drfrankenstein.co.uk/?4b9142dd459777a9#C6LWx35DHwshvHPXzsDfrVVkvaSRQEc1tBBRsnNGsbvd
Running
sudo docker exec scrutiny /opt/scrutiny/bin/scrutiny-collector-metrics run
…returns:
Loading configuration file: /opt/scrutiny/config/collection.yaml
…but nothing changes, the dashboard stays blank.
When I run:
smartctl –scan
it returns: scan_smart_devices: glob(3) aborted matching pattern /dev/discs/disc*
This issue on the github suggests the collector.yaml isn’t working
https://github.com/AnalogJ/scrutiny/issues/751
Any suggetions?
Thanks for the details – your setup is spot on perfect so I can’t see any issue there – my 1821+ is still pulling info just fine – I will reply in the bug report as well.
Great tuff, thanks for tutorial been looking for something like that for while!
It would be amazing if could somehow pass through data to my home assistant so can monitor all in one place.
Also looks like Scrutiny is supported by Heimdall so easy to add it to my existing dashboard
As always, thanks for your guide Doc!
I’ve just set this up and took a look. one of my drives failed (even though Synology dsm had no idea!). is there a way I could manually issue a retest of a specific drive or all of them to make sure?
also I’m struggling to figure out which drive it relates to on synology’s storage manager. whats the trick to identifying the correct drive on dsm?
Hey – Keep in mind a Failed drive in Scrutiny may mean its failing Scrutiny checks but not actually failed SMART checks. It’s more for info – For example I have an 8TB EXOs that Scrutiny fails however its due to it having a slow spin up at some point. So it’s not perfect, but I am happy to leave it running 24/7.
I use the drive Serial numbers to see which drive is which. You can also (on some models) click on the Drive in the HDD list and click ‘Locate’ to flash the drive LED amber.
Hi, thanks you so much for this nice guide.
I have one issue though. It only shows 8 drives in total while i have a Synology DX517 connected with 5 more drives
For me it does not show 4 drives of the external unit and 1 drive from the main unit. Did you locked it at 8 drives max?
Hey, it would be useful to see your config file and output of the command to see your drives as you should be able to add as many as you need.
Use my https://paste.drfrankenstein.co.uk
Upload the config file & compose & attach the screenshot. Then reply to this with the URL … I will reply with amendments if required.